Overview
Simple Network Management Protocol (SNMP) lets third-party network monitoring platforms retrieve information from network devices. You can configure SNMP monitoring in the Cato Management Application (CMA) and connect your monitoring platform to Cato Sockets, vSockets, and App Connectors. This lets you view Cato device health and interface statistics alongside routers, switches, and other devices in platforms such as SolarWinds, PRTG, or OpenNMS.
The monitoring platform acts as the SNMP manager. Each monitored Cato appliance runs an SNMP agent that responds to requests initiated through read-only SNMPv3 polling with authentication and encryption.
You configure one SNMP profile for the account and enable it for the sites you want to monitor. Your monitoring platform then retrieves data directly from each monitored Socket.
Use Cases
Monitor CPU and memory usage across branch Sockets to identify devices approaching resource limits.
Track LAN and WAN interface status and traffic utilization alongside other network equipment in your monitoring dashboard.
Investigate increasing interface errors or discarded packets when troubleshooting degraded application performance.
Prerequisites
Socket v28 or higher
Your monitoring platform must support SNMPv3 with the authPriv security level, SHA-256 authentication, and AES-128 privacy (encryption).
The monitoring server must have network connectivity to the polling address of the monitored appliance. Allow UDP port 161 along the polling path, including any applicable firewall rules or cloud security groups.
The following capabilities and limitations apply:
Capability | Support |
|---|---|
Read operations | GET, GETNEXT, GETBULK, and walks using these read operations. |
Write operations | SNMP SET is not supported. SNMP cannot be used to change Socket configuration. |
Traps and informs | Not supported. The monitoring platform must poll the appliance to retrieve information. |
Understanding How Sockets Are Polled
Configure the monitoring platform to poll each Socket using that Socket's own LAN IP address. This applies both when the monitoring server is on the Socket's local network and when it reaches a Socket at another site through the Cato Cloud.
For example, a monitoring server at Site A monitors the Socket at Site B by sending SNMP requests to the LAN IP address of the Socket at Site B. The requests travel through the Cato Cloud, and the Socket at Site B returns its own data. The Socket at Site A forwards the traffic along the network path.
Note: Use the target Socket's LAN IP as the polling destination, including for requests sent over the WAN. Do not use its WAN IP or the LAN IP of a different Socket as the target.
Locating the Socket LAN IP
For a single-Socket site, in the Networks page for the site, locate the Local IP of the Native network range. Use this address as the polling destination when adding the Socket to your SNMP monitoring platform. For more information about network ranges, see Configuring Network Ranges for a Site.
Polling an HA Site
In Socket HA deployments, both the primary and secondary Sockets respond to SNMP polling as separate appliances. Each Socket is polled using its management IP address and returns its own interface statistics.
To locate these addresses, go to the Socket page for the site, and under High Availability Configurations locate the Primary Management IP and Secondary Management IP.
Use each address as the polling destination when adding the corresponding Socket to your SNMP monitoring platform. Add the primary and secondary Sockets as separate monitored devices.
Note: Counters can reset after a reboot, upgrade, or HA failover. Configure your monitoring platform to handle counter resets so that they do not appear as sudden traffic spikes.
Configuring SNMP in the CMA
First create the account SNMP profile, and then enable SNMP for the required sites.
Configuring the SNMP Profile
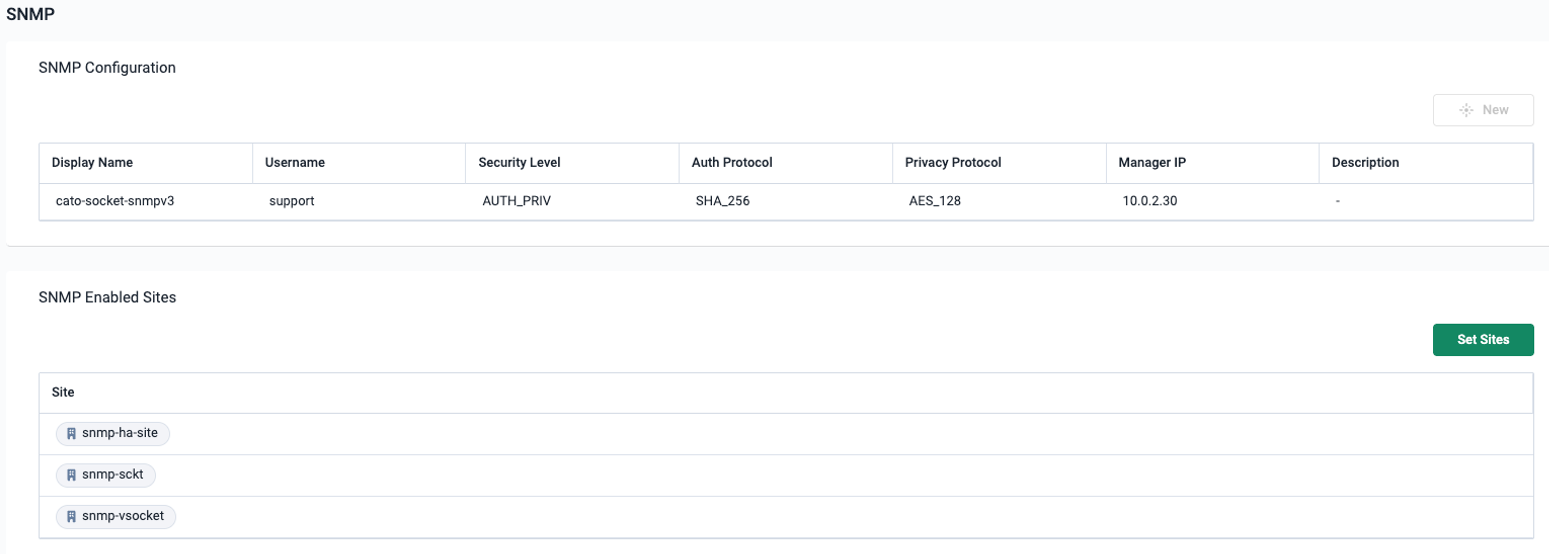
The profile defines the credentials used by the monitoring platform to authenticate to the Sockets. The display name identifies the profile in the CMA, and the username is the SNMP identity that must match in your monitoring platform.
Security level, auth protocol, and privacy protocol are not configurable.
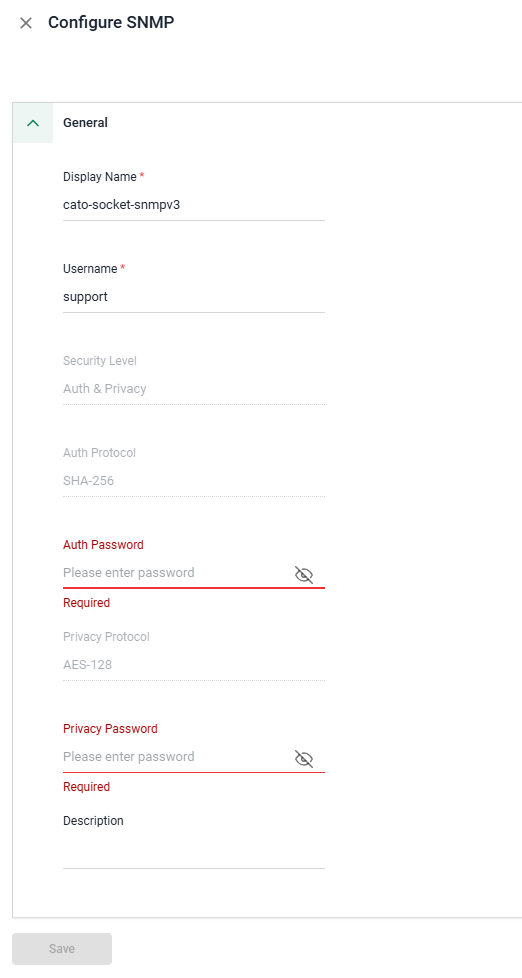
To configure the SNMP profile:
From the navigation menu, click Network > SNMP.
In the SNMP Configuration section, click New. The Configure SNMP panel opens.
Enter a Display Name for the profile.
Enter the Username that your monitoring platform will use for SNMP requests.
Enter the Auth Password for SHA-256 authentication and the Privacy Password for AES-128 encryption. Each password must contain at least eight characters.
Enter a Description.
Click Save. The SNMP profile is created for the account.
Saved passwords are not displayed when you reopen the profile. To replace a password, use Edit Password for the relevant field. If you change the profile's username or passwords, update the matching credentials in your monitoring platform for all devices using that profile.
Enabling SNMP for Sites
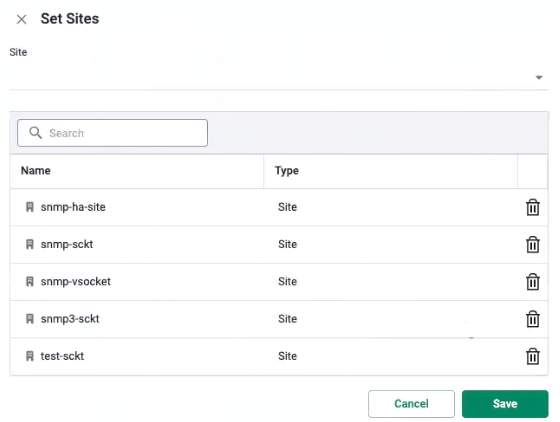
To enable SNMP for Socket sites:
From the navigation menu, click Network > SNMP.
In the SNMP Enabled Sites section, click Set Sites. The Set Sites panel opens.
From the Site dropdown, select the sites you want to monitor. Only Sockets running v28 or higher appear.
Click Save. The sites appear on the SNMP Enabled Sites list.
After the configuration reaches the Socket, it can respond to requests using the account profile. Configure the matching credentials and polling targets in your monitoring platform as described below.
Configuring Your Monitoring Platform
Configure the SNMPv3 credentials in your monitoring platform to match the profile in the CMA. The field names depend on the platform.
Monitoring-platform setting | Value |
|---|---|
SNMP version | SNMPv3 |
Security level | Authentication and privacy (authPriv) |
Username or security name | The Username configured in the CMA profile |
Authentication protocol | SHA-256 |
Authentication password or passphrase | The Auth Password configured in the CMA profile |
Privacy or encryption protocol | AES-128 (AES-CFB-128) |
Privacy password or passphrase | The Privacy Password configured in the CMA profile |
Polling destination for a single-Socket site | That Socket's LAN IP address |
Transport and port | UDP/161 |
Add a separate polling target for each Socket you want to monitor, and associate the matching SNMPv3 credentials with each target.
Run the platform's SNMP discovery or credential test to retrieve device and interface information. Refer to your monitoring platform's documentation for adding nodes, selecting a polling interval, and configuring dashboards and alerts.
Supported Monitoring Data
SNMP identifies information using an Object Identifier (OID). A Management Information Base (MIB) describes the objects, their data types, and their meanings. The following MIB areas provide the supported monitoring data. Support applies to the objects listed below and does not imply support for every object in each MIB.
MIB Area | OID Root | Available Information |
|---|---|---|
System |
| Device identity and location, SNMP agent uptime, and registered MIB capabilities. |
Interfaces |
| LAN/WAN interface details, status, MTU, speed, and traffic counters. |
IPv4 Addresses |
| Interface IPv4 addresses, subnet masks, and related address information. |
Host Resources |
| Per-core CPU load and physical RAM information. |
IF-MIB Extensions |
| Interface names and aliases, high-capacity byte and packet counters, and additional interface properties. |
Cato Private MIB |
| Socket identity and health, interface details, and tunnel/PoP information. |
Reading the OID Reference
An OID ending in .0 identifies a scalar value. Table entries use an index suffix. Replace the placeholders below with the instance returned by the agent; the angle brackets are not part of the numeric OID.
<row>: row in the registered-capabilities table.<if>: interface instance in the relevant table.<ip>: IPv4 address expressed as a dotted numeric suffix.<cpu>: processor instance.<tunnel>: tunnel instance.
Use an SNMP walk to discover the available table instances. Index objects identify rows; they are not necessarily independently readable values. The physical RAM entries below use the specific row index 1.
System
Device information, SNMP agent uptime, and registered MIB capabilities.
Object | OID | Available Information |
|---|---|---|
|
| Device description, including platform and software information. |
|
| Vendor or device-type object identifier. |
|
| Time since the SNMP agent was initialized, in hundredths of a second. |
|
| Administrative contact information. |
|
| Device name; maps to the site name. |
|
| Device location; maps to the site address. |
|
| Network service layers supported by the device. |
|
| Value of sysUpTime when the registered-capabilities table last changed. |
|
| Row identifier in the registered-capabilities table. |
|
| Object identifier for a registered MIB capability. |
|
| Description of the registered capability. |
|
| Value of sysUpTime when the capability row was registered. |
Uptime: sysUpTime.0 measures SNMP agent uptime, which can reset when the agent restarts without a Socket reboot. The standard object intended to report Socket boot uptime, hrSystemUptime.0 (1.3.6.1.2.1.25.1.1.0), is currently unavailable because of a known issue and is not included in the supported-object list.
Interfaces
Standard interface information and traffic counters for the exposed LAN/WAN interfaces.
Object | OID | Available Information |
|---|---|---|
|
| Number of interfaces exposed through SNMP. |
|
| Interface identifier. |
|
| Interface description. |
|
| Interface type. |
|
| Maximum packet size for the interface, in bytes. |
|
| Reported interface speed, in bits per second. |
|
| Interface physical address, such as its MAC address. |
|
| Configured administrative state. |
|
| Current operational state. |
|
| Value of sysUpTime at the latest operational-state change. |
|
| Received bytes, as a 32-bit counter. |
|
| Received unicast packets. |
|
| Received multicast and broadcast packets. |
|
| Received packets discarded without errors. |
|
| Received packets containing errors. |
|
| Received packets discarded because of an unknown or unsupported protocol. |
|
| Transmitted bytes, as a 32-bit counter. |
|
| Outbound unicast packet requests. |
|
| Outbound multicast and broadcast packet requests. |
|
| Outbound packets discarded without errors. |
|
| Outbound packets not transmitted because of errors. |
|
| Output queue length, in packets. |
|
| Reference to interface media-specific MIB definitions. |
IPv4 Addresses
IPv4 address information for the exposed interfaces.
Object | OID | Available Information |
|---|---|---|
|
| Interface IPv4 address. |
|
| Interface index associated with this IPv4 address. |
|
| Subnet mask for this IPv4 address. |
|
| Least significant bit of the interface broadcast address. |
|
| Maximum IP datagram reassembly size for the interface, in bytes. |
Host Resources
Per-core CPU load and physical RAM information. The listed storage objects describe RAM; they do not add disk or process monitoring.
Object | OID | Available Information |
|---|---|---|
|
| Per-core CPU utilization, averaged over approximately the preceding minute. |
|
| Total physical RAM, in KB. |
|
| Storage row identifier; row 1 represents physical RAM. |
|
| Storage type for the physical RAM row. |
|
| Description of the physical RAM row. |
|
| Number of bytes in one allocation unit. |
|
| Total RAM size, in allocation units. |
|
| Used RAM, in allocation units. |
|
| Allocation requests that failed because of insufficient storage. |
For the RAM row, calculate memory utilization as hrStorageUsed / hrStorageSize × 100. To convert the total or used size to bytes, multiply it by hrStorageAllocationUnits.
IF-MIB Extensions
Additional interface identifiers, properties, and 64-bit traffic counters.
Object | OID | Available Information |
|---|---|---|
|
| Interface name. |
|
| Received bytes, as a 64-bit counter. |
|
| Received unicast packets, as a 64-bit counter. |
|
| Transmitted bytes, as a 64-bit counter. |
|
| Outbound unicast packet requests, as a 64-bit counter. |
|
| Reported interface speed, in millions of bits per second (Mbps). |
|
| Reported promiscuous-mode state. |
|
| Whether the interface has a physical connector. |
|
| Interface alias or descriptive label. |
Use the 64-bit byte counters for traffic-rate calculations where your monitoring platform supports them. The speed objects describe reported interface bandwidth, not measured traffic throughput: ifSpeed uses bits per second, while ifHighSpeed uses Mbps. All listed objects are available through Cato's read-only polling implementation; their presence does not enable SNMP SET operations.
Cato Private MIB
The Cato private MIB under 1.3.6.1.4.1.64366 exposes Socket-specific identity, health, interface, and tunnel information.
Socket Identity and Status
Object | OID | Available Information |
|---|---|---|
|
| Socket model. |
|
| Socket hardware revision. |
|
| Socket serial number. |
|
| Socket firmware version. |
|
| Socket software build revision. |
|
| Socket role reported by the agent. |
|
| Socket boot-time value reported by the agent. |
|
| Socket uptime value reported by the agent. |
|
| Socket health state reported by the agent. |
Interface Details
Object | OID | Available Information |
|---|---|---|
|
| Interface identifier in the Cato interface table. |
|
| Configured interface destination. |
|
| WAN outlet identifier associated with the interface. |
|
| Interface state reported by the agent. |
Tunnel and PoP Details
Object | OID | Available Information |
|---|---|---|
|
| Tunnel identifier in the Cato tunnel table. |
|
| Interface identifier associated with the tunnel. |
|
| Tunnel status code reported by the agent. |
|
| Tunnel MTU reported by the agent. |
|
| Discovered tunnel MTU reported by the agent. |
|
| Tunnel network MTU reported by the agent. |
|
| Server IP address for the tunnel. |
|
| Name of the PoP associated with the tunnel. |
|
| Tunnel connection duration, in seconds. |