Overview
The Cloud Apps Dashboard provides centralized visibility into your organization's application usage and is the starting point for SaaS security.
The dashboard combines these three domains into a unified view based on inline data and the apps you have created connectors for
App discovery & control: which applications are used, by whom, whether they are sanctioned, and what actions Cato has taken on their traffic
Sourced from inline traffic that passes through the Cato Cloud. Application usage, risk, and upload and download volumes are shown without any configuration. Activity-level and tenant-level data require Application Control and TLS Inspection
SaaS security posture: How securely your connected applications are configured, which checks have failed, and which secure settings have been weakened (posture drift)
Sourced from SaaS Posture and Interconnected Apps connectors. Posture drifts come from App Activities connectors
SaaS Events: SaaS alerts and other security events generated from activity inside your applications
Sourced from App Activities connectors
By combining visibility with control, the Cloud Apps Dashboard helps reduce risk, ensure compliance, and protect sensitive data while still allowing employees to work with the tools they need.
A CASB license is required for the Cloud Apps Dashboard. For more information about purchasing a CASB license, please contact your Cato representative.
Use Cases
Identifying Risky Applications
The Risky Apps tile in the highlights bar shows new applications with a high risk score. The security administrator clicks the tile, which opens the Inventory tab filtered to risky apps. Employees have started using a high-risk file sharing application. The administrator classifies it as unsanctioned and creates an Internet Firewall rule that blocks it.
Prioritizing Posture Remediation
In the Apps Coverage section, the team identifies that Salesforce is one of the most-used applications but has no SaaS Posture connector. The administrator clicks the link, which opens the Integrations page, and creates the connector. After the posture checks run, the High Severity Failed Posture Checks tile shows new failed checks. The administrator clicks the tile, which opens the Posture page filtered to those checks. One check shows that MFA isn't enforced for Salesforce administrators. The administrator creates a Jira ticket from the check and assigns it to the Salesforce owner.
Preventing Configuration Regression
The Posture Drifts tile shows a high-severity drift. The Top Posture Drifts widget shows that Gmail auto-forwarding was turned on in Google Workspace, a setting the team had turned off. The administrator reviews the remediation guidance in the linked posture check and asks the Google Workspace owner to revert the change.
Reviewing Risky Interconnected Apps
The Top Risky Interconnected Apps widget shows that Microsoft 365 has risky interconnected apps. In Interconnected Apps, the administrator finds a third-party app with an application-level permission to read every mailbox in the organization, although it only needs calendar access. The administrator works with the Microsoft 365 owner to remove the permission.
Responding to a SaaS Alert
The High Severity SaaS Alerts tile shows an Outlook External Inbox Forward Rule Created alert for a finance user. The security administrator clicks the tile, which opens the Events page filtered to high-severity SaaS alerts, and reviews the user's recent App Activities. The user didn't create the rule, so the team removes it, revokes the user's sessions, and resets the user's credentials.
Getting Started with the Cloud Apps Dashboard
To access the Cloud Apps Dashboard, navigate to Security > Cloud Apps.
The Cloud Apps Dashboard is split into three tabs:
Overview: Holistic visibility of the Apps used in your environment and measurements of how secure they are
Activities: Centralized and comprehensive visibility of user activities in the SaaS applications used in your ecosystem
Inventory: This tab lists all the apps used in your environment and provides high-level information about the app
Understanding the Overview Tab
The Overview tab provides configurable widgets that analyze usage and security posture of the apps in your environment.
Understanding the Summary Section
This table explains the widgets in the Summary section.

Name | Description |
|---|---|
Risky Apps | The number of apps with a high risk score identified in your environment. The trend compares this number with the previously equivalent time range. Clicking on the link navigates to the Inventory tab with a predefined filter to display the risky apps. |
High Severity SaaS Alerts | The number of high severity alerts raised. The trend compares this number with the previously equivalent time range. Clicking on the link navigates to the Events page with a predefined filter to display the alerts. |
High Severity Failed Posture Checks | The number of high severity posture checks that have failed. Clicking on the link navigates to the Posture page with a predefined filter to display the failed checks. |
Posture Drifts | The number of Posture checks that degraded grouped by severity. |
Understanding the Apps Coverage Section
This section lists the apps used within your environment, and the SaaS security functionality you have enabled for each app. App Activity, SaaS Posture, and Interconnected Apps are all enabled by creating a connector for the app.

The table below explains the widgets in the Apps Coverage Section:
Name | Description |
|---|---|
Common Capabilities | The number of available capabilities based on the supported apps used in your environment. |
By Application Usage | A list of ordered apps used in your environment, ordered by usage, and the status of the connector for each capability. If you have not created a connector for an app, the link navigates to the Integrations page. If capability for the app is not supported, you can send a request for this coverage. |
Understanding the Application Security by Domain Section
This section is split into three based on the domain of SaaS security you want to investigate more. The three key domains are:
App discovery & control: To view CASB insights
SaaS security posture: To view the security posture of the SaaS apps in your environment
SaaS events: To view alerts and events generated by SaaS applications
App Discovery & Control

The table below lists the widgets in the App Discovery & Control section. You can display each of these widgets by the number of apps, users, or usage.
Name | Description |
|---|---|
App Classification by | Sanctioned and unsanctioned apps used in your environment. |
TLS Inspection | Number of apps inspected by TLS. |
Top Users | Users with the highest network usage of apps. |
App Categories | Number of apps split by category. |
Events by Action | Breakdown of the action Cato has taken on events generated by apps. |
SaaS Security Posture

The table below lists the widgets in the SaaS Security Posture section:
Name | Description |
|---|---|
Top 5 SaaS Posture Checks | The 5 posture checks with the highest number of findings. This can be filtered by the severity of the check. |
Posture Score | The percentage of passed posture checks by application. |
Top Posture Drifts | Posture drift detection identifies configuration changes that cause previously passing checks to fail. This helps you detect regressions after an application has been configured securely. Review the failed check to understand the change and coordinate remediation with the application owner. |
Posture Score by Label | The percentage of posture checks passed based on industry benchmarks. |
Top Risky Interconnected Apps | The apps with the highest number of interconnected apps. This helps you visually track connections between applications. |
SaaS Events

The table below lists the widgets in the SaaS Events section:
Name | Description |
|---|---|
Alerts to Review | SaaS alerts that Cato creates automatically from the audit logs of connected apps, grouped by severity. |
Active Stories | Open stories related to application and data security. |
Threat Detection Events Related to SaaS | The number of threat detection events generated by SaaS apps, grouped by application. |
Understanding the Activities Tab
Understanding the Usage Flow Sankey Diagram
For increased visibility of how SaaS applications are used in your network, the sankey diagram to visualize application usage flow in your network.
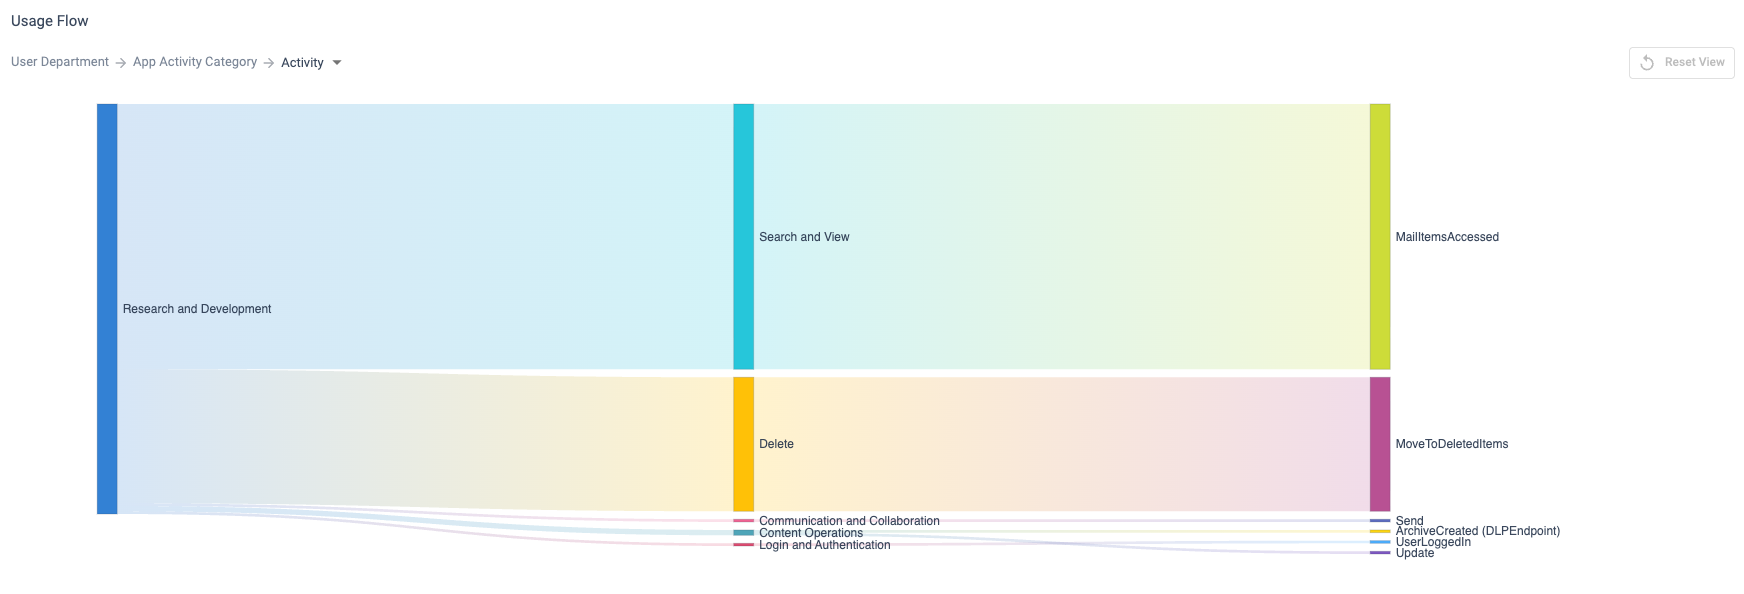
Understanding the Audit Activities Section
This table explains the widgets in the Audit Activities section:
Name | Description |
|---|---|
Activities Over Time | Frequency each Activity Category has occurred during the time range and filter. |
Users | Frequency each user has completed an activity. |
Activities Distribution | Distribution each activity has occurred as a percentage of total activities. |
Applications | Frequency an activity has occurred in each application. |
Files | Files that have been uploaded or downloaded. |
Understanding the SSO Sign Ins Section
This table explains the widgets in the SSO Sign In Section:

Name | Description |
|---|---|
Sanctioned Apps Sign-In Activity | Shows SSO sign-in information for all of your organization's sanctioned SaaS apps that use SSO. You can click in the row of an app to show the Events page pre-filtered for sign-in events for the app. These are the widget columns:
Click in the row of an app to show the Events page pre-filtered for sign-in events for the app |
Activity Categories by Countries | Shows the following information for sign-ins from each country:
|
Top Users With Failed Sign-in | A list of users with the most failed sign-ins for a single app, with the name of the app and number of failed sign-ins. |
Top Sign-ins Outside of Cato | A list of users with the most sign-ins for a single app outside of Cato, with the name of the app and number of failed sign-ins. |
Top Sign-in Anomalies | A list of users with the most sign-in anomalies. |
Sign-in Activity Over Time | Graphs the total and failed sign-ins on a timeline
|
Anomalies | Anomalous sign-ins in your Entra ID tenant that may indicate malicious activity. Anomaly types include: Atypical travel, Anomalous token, Suspicious browser, Unfamiliar sign-in properties, Malicious IP address, Suspicious inbox manipulation rules, Password spray, Impossible travel, New country, Activity from anonymous IP address, Suspicious inbox forwarding, Mass access to sensitive files, Verified threat actor IP, Additional risk detected, Anonymous IP address, Admin confirmed user compromised, Microsoft Entra threat intelligence. |
Sign-in Break Down by OSs | Shows number of app sign-ins performed on each operating system. Hover the mouse over a chart section to show the number of sign-ins for that operating system and its percentage of total sign-ins. |
Sign-in Break Down by Browser | Shows number of app sign-ins performed on each browser. Hover the mouse over a chart section to show the number of sign-ins for that browser and its percentage of total sign-ins. |
Understanding the Inventory Tab
For a high-level view, the Inventory tab provides a list of all the apps used in your environment, how they are used and their risk score and security status.

Clicking on an app opens the App Quick View drawer which provides more detailed information about the app including Security & Compliance information, and the Throughput through the app. Click on the Classification to change the security status of the app directly from this drawer.